San Francisco, CA

Polk Neighborhood
Traffic Safety Analysis

Produced by Polk Neighbors
The Polk

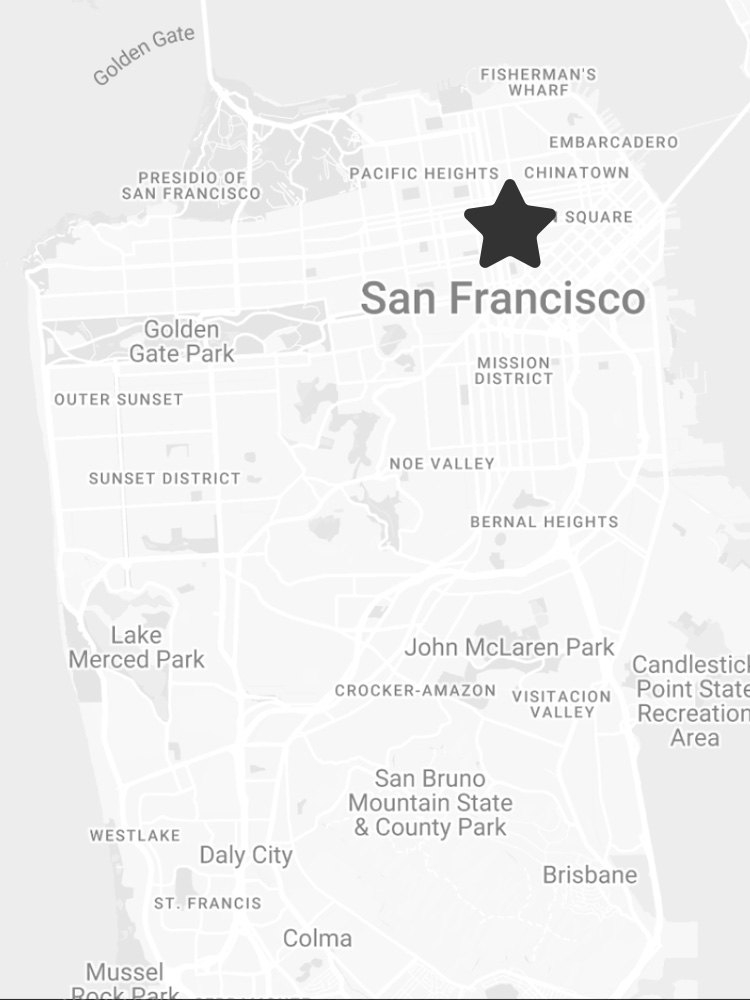
Is a predominately car-free neighborhood in San Francisco where 70% of residents walk, bike or take public transit to work. Yet wide, one way streets encourage fast moving cut-through traffic that injures a resident every 4.15 days.

Polk neighbors is calling on the SFMTA to install traffic calming measures at our most dangerous intersections and around our schools to protect the people who live and work here.
Population
10,890
Median Income
$71,619
Area
0.14 Sq Miles
More Data
Help us make our streets safe and accessible for everyone
Traffic Crashes
In 2024 drivers hit and injured 97 of our neighbors with their car. Our neighborhood sees, on average, 88 vehicle crashes each year. That's a crash approximately every 4.15 days. It only takes one crash to completely upend someone's life or destroy an entire family.
Injury Severity
Travel Mode
Time of Day

In the past 18 months there have been 113 vehicle crashes in our neighborhood that have hurt someone. These 113 crashes would not have happened if the SFMTA designed our streets to priortize our neighborhood's safety over fast moving cars. These preventable crashes killed 1 and injured 125 of our neighbors.

Minor
Severe
Fatal
Crash data is sourced from the San Francisco Department of Health which releases updates approximately every three months. The most recent data available is through April 30th, 2025.
Help us make our streets safe and accessible for everyone
Explore Our Neighborhood
Select any intersection to view its crash history and learn about the people who live near it. Then tap its star to learn how you can get involved and help us make it safer.
Star Intersections To Follow Them
ellis st & hyde st
56 Injured  |  1 Killed
o'farrell st & hyde st
51 Injured  |  0 Killed
larkin st & ellis st
56 Injured  |  0 Killed
o'farrell st & larkin st
59 Injured  |  0 Killed
hyde st & post st
42 Injured  |  2 Killed
sutter st & hyde st
21 Injured  |  0 Killed
geary st & hyde st
40 Injured  |  0 Killed
post st & larkin st
60 Injured  |  0 Killed
larkin st & geary st
65 Injured  |  0 Killed
hyde st & bush st
43 Injured  |  0 Killed
polk st & ellis st
71 Injured  |  2 Killed
polk st & o'farrell st
84 Injured  |  2 Killed
geary st & polk st
97 Injured  |  1 Killed
van ness ave & ellis st
91 Injured  |  0 Killed
o'farrell st & van ness ave
95 Injured  |  1 Killed
geary blvd & van ness ave
100 Injured  |  0 Killed
polk st & post st
78 Injured  |  0 Killed
larkin st & sutter st
63 Injured  |  0 Killed
bush st & larkin st
38 Injured  |  0 Killed
larkin st & pine st
27 Injured  |  1 Killed
polk st & sutter st
78 Injured  |  0 Killed
polk st & bush st
38 Injured  |  0 Killed
van ness ave & post st
54 Injured  |  2 Killed
van ness ave & sutter st
65 Injured  |  1 Killed
polk st & california st
48 Injured  |  0 Killed
pine st & polk st
74 Injured  |  1 Killed
bush st & van ness ave
55 Injured  |  1 Killed
california st & van ness ave
85 Injured  |  0 Killed
van ness ave & pine st
79 Injured  |  1 Killed
pine st & hyde st
27 Injured  |  0 Killed
hyde st & california st
49 Injured  |  2 Killed
larkin st & california st
48 Injured  |  0 Killed
All Intersections
ellis st & hyde st
Crash Statistics
Demographics
Since 2005 there have been 52 vehicle crashes within 100 feet of this intersection which have injured 56 people and killed 1. The most recent crash was on March 23rd, 2025.
The most recent crash data available is through April 30th, 2025.
Hear Our
Stories

Hear what it's like to live in The Polk and why we need to install more traffic calming measures and limit dangerous cut-through traffic.

Take Action

Join us at our next event and help us demand safer and more equitable streets in The Polk.

Upcoming
Past
Additional
Reading

Learn more about recent traffc safety updates in The Polk and remember our neighbors we lost to car violence.

About This Project

This project was produced by Polk Neighbors, a 501(c)(3) non-profit that has been representing residents of The Polk / Nob Hill neighborhood for over 40 years. Creative direction, engineering and data analysis by Stephen Braitsch. Visual and UX design by Snehal Ladke. Aerial drone footage by Brian Johnson.

Crash data is published quarterly by the San Francisco Department of Public Health and neighborhood demographic data is sourced from the U.S. Census American Community Survey (ACS) 5-Year estimates (2019 - 2023).

Let's make your
neighborhood safer
Let's make your neighborhood safer